90 lines
3.5 KiB
Markdown
90 lines
3.5 KiB
Markdown
|
|
# Visual Studio Code Setup
|
||
|
|
|
||
|
|
## Table of Contents
|
||
|
|
|
||
|
|
* [V language support](#v-language-support)
|
||
|
|
* [Visual Debugging](#visual-debugging)
|
||
|
|
|
||
|
|
## V language support
|
||
|
|
|
||
|
|
The [V VS Code Extention](https://marketplace.visualstudio.com/items?itemName=vlanguage.vscode-vlang) provides V language support for Visual Studio Code.
|
||
|
|
|
||
|
|

|
||
|
|
|
||
|
|
**Features:**
|
||
|
|
* Syntax Highlighting.
|
||
|
|
* Code Snippets for quick coding.
|
||
|
|
* Format code on file save as well as format manually (using v fmt).
|
||
|
|
* Linter (Workspace files only).
|
||
|
|
[more](https://marketplace.visualstudio.com/items?itemName=vlanguage.vscode-vlang)
|
||
|
|
|
||
|
|
**Hint:** This extention will not add the V compiler! Information on how to [install V compiler](https://github.com/vlang/v/blob/master/doc/docs.md#install-from-source) on your operating system.
|
||
|
|
|
||
|
|
### Setup
|
||
|
|
|
||
|
|
Install [V VS Code Extention](https://marketplace.visualstudio.com/items?itemName=vlanguage.vscode-vlang).
|
||
|
|
|
||
|
|
## Visual Debugging
|
||
|
|
|
||
|
|
|
||
|
|
|
||
|
|
The [C/C++ Extention](https://marketplace.visualstudio.com/items?itemName=ms-vscode.cpptools) for Visual Studio Code provides visual conditional debugging.
|
||
|
|
|
||
|
|
**Features:**
|
||
|
|
* Conditional breakpoints
|
||
|
|
* Function breakpoints
|
||
|
|
* Expression evaluation
|
||
|
|
* Change Values
|
||
|
|
[more Features & Documentation](https://code.visualstudio.com/docs/cpp/cpp-debug)
|
||
|
|
|
||
|
|
**Hint:** Not all types (e.g. Array) in V currently create the required [DWARF](https://en.wikipedia.org/wiki/DWARF) information to show and edit the variable.
|
||
|
|
|
||
|
|
### Setup
|
||
|
|
|
||
|
|
1. Install the [C/C++ Extention](https://marketplace.visualstudio.com/items?itemName=ms-vscode.cpptools)
|
||
|
|
2. Open `RUN AND DEBUG` panel (Debug Icon in left panel).
|
||
|
|
3. Click on `Show` all automatic debug configurations.
|
||
|
|
4. Select `Add config`.
|
||
|
|
5. Select environment `C++ (GDB/LLDB)`.
|
||
|
|
6. Change the line `"program": "Programmnamen eingeben, z. B. \"${workspaceFolder}/a.out\"",` to point to your compiled application e.g. `"program": "${workspaceFolder}/hello",`.
|
||
|
|
|
||
|
|
This will add a block to your `.workspace` file or creates the file `.vscode/launch.json`:
|
||
|
|
```json
|
||
|
|
{
|
||
|
|
// Use IntelliSense to learn about possible attributes.
|
||
|
|
// Hover to view descriptions of existing attributes.
|
||
|
|
// For more information, visit: https://go.microsoft.com/fwlink/?linkid=830387
|
||
|
|
"version": "0.2.0",
|
||
|
|
"configurations": [
|
||
|
|
{
|
||
|
|
"name": "(lldb) Starten",
|
||
|
|
"type": "cppdbg",
|
||
|
|
"request": "launch",
|
||
|
|
"program": "Programmnamen eingeben, z. B. \"${workspaceFolder}/a.out\"",
|
||
|
|
"args": [],
|
||
|
|
"stopAtEntry": false,
|
||
|
|
"cwd": "${fileDirname}",
|
||
|
|
"environment": [],
|
||
|
|
"externalConsole": false,
|
||
|
|
"MIMode": "lldb"
|
||
|
|
}
|
||
|
|
]
|
||
|
|
}
|
||
|
|
```
|
||
|
|
|
||
|
|
### Usage
|
||
|
|
|
||
|
|
To allow your compiled application to be debugged. The application needs to include additional debugging information ([DWARF](https://en.wikipedia.org/wiki/DWARF)).
|
||
|
|
|
||
|
|
**1. Compile with debugging information:**
|
||
|
|
`v -b c -g hello.v -o hello` or short `v -g hello.v`
|
||
|
|
|
||
|
|
The `-g` option will add the needed debugging informations. More Options are explained in the [docs](docs.md#debugging).
|
||
|
|
|
||
|
|
|
||
|
|
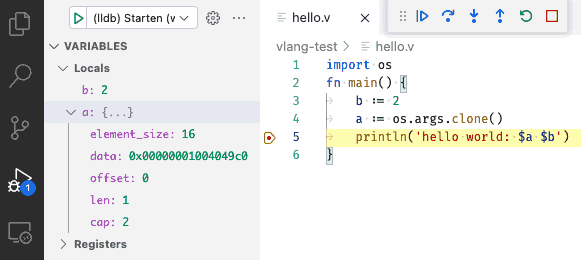
**2. Start Debugging**
|
||
|
|
|
||
|
|
1. Open your source code and set the required break points
|
||
|
|
2. Click on the Debug Icon in the left Icon panel and klick `> (lldb) Start` or use `F5` to launch your application in debug mode.
|
||
|
|
|
||
|
|
For all options look at the official [C/C++ Extention documentation](https://code.visualstudio.com/docs/cpp/cpp-debug).
|