3.7 KiB
Visual Studio Code Setup
Table of Contents
V language support
The V VS Code Extention provides V language support for Visual Studio Code.

Features:
- Syntax Highlighting.
- Code Snippets for quick coding.
- Format code on file save as well as format manually (using v fmt).
- Linter (Workspace files only). more
Hint: This extention will not add the V compiler! Information on how to install V compiler on your operating system.
Setup Extention
Install V VS Code Extention.
Visual Debugging
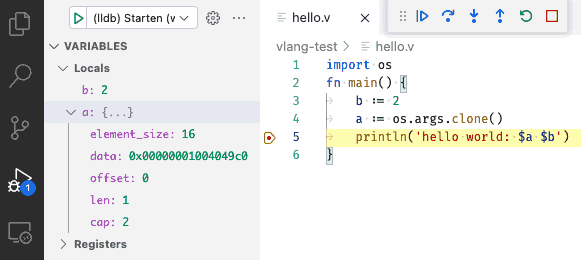
The C/C++ Extention for Visual Studio Code provides visual conditional debugging.
Features:
- Conditional breakpoints
- Function breakpoints
- Expression evaluation
- Change Values more Features & Documentation
Hint: Not all types (e.g. Array) in V currently create the required DWARF information to show and edit the variable.
Setup Debugging
- Install the C/C++ Extention
- Open
RUN AND DEBUGpanel (Debug Icon in left panel). - Click on
Showall automatic debug configurations. - Select
Add config. - Select environment
C++ (GDB/LLDB). - Change the line
"program": "Enter the program name, e.g. \"${workspaceFolder}/a.out\"",to point to your compiled application e.g."program": "${workspaceFolder}/hello",.
This will add a block to your .workspace file,
or create the file .vscode/launch.json:
{
    // Use IntelliSense to learn about possible attributes.
    // Hover to view descriptions of existing attributes.
    // For more information, visit:
	// https://go.microsoft.com/fwlink/?linkid=830387
    "version": "0.2.0",
    "configurations": [
        {
            "name": "(lldb) Start",
            "type": "cppdbg",
            "request": "launch",
            "program": "Enter the program name, e.g. \"${workspaceFolder}/a.out\"",
            "args": [],
            "stopAtEntry": false,
            "cwd": "${fileDirname}",
            "environment": [],
            "externalConsole": false,
            "MIMode": "lldb"
        }
    ]
}
Optional: use "program": "${fileDirname}/${fileBasenameNoExtension}" to debug
any current open source file with an existing binary with the same name but without any extension.
Usage
To allow your compiled application to be debugged. The application needs to include additional debugging information (DWARF).
1. Compile with debugging information:
v -b c -g hello.v -o hello or short v -g hello.v
The -g option will add the needed debugging informations.
More Options are explained in the docs.
2. Start Debugging
- Open your source code and set the required break points
- Click on the Debug Icon in the left Icon panel and click
> (lldb) Start, or useF5to launch your application in debug mode.
For all options look at the official C/C++ Extention documentation.